Core emissions (Scopes 1 and 2)
Scope 1 and 2 emissions are those within the council's greatest control. They relate to emissions from fuels and electricity used in council-operated buildings, vehicles, and other assets.
These have reduced by 20.4% from 2019-20 to 2022-23.
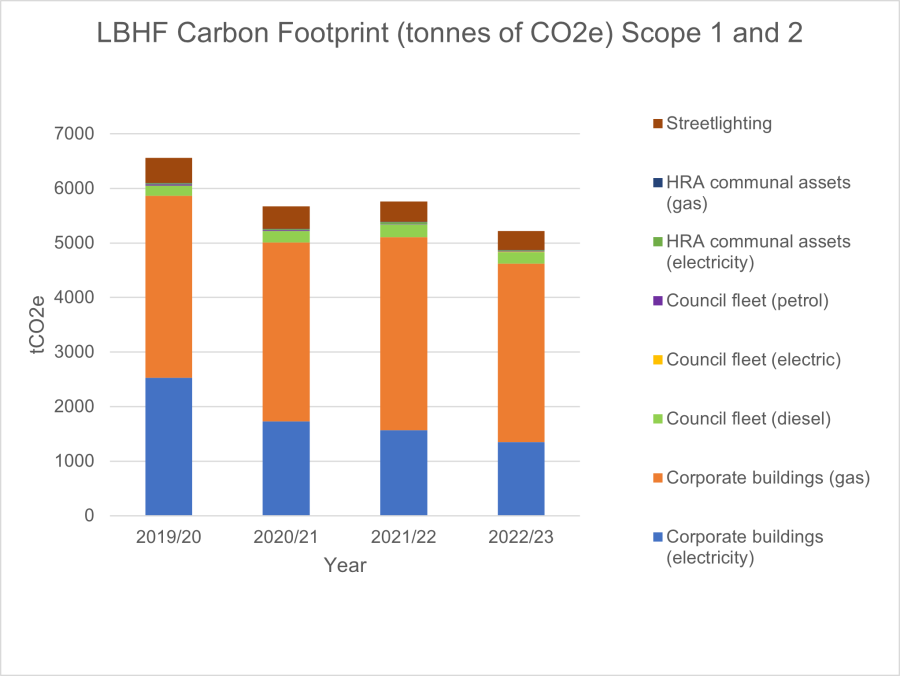
The largest proportion of emissions in this footprint (63%) is from gas use in council-operated non-domestic buildings, including schools. Gas use returned to pre-pandemic levels after 2021, but the completion this year of our first heat pump projects in our corporate retrofit programme means we will see reductions from the 2023-24 footprint onwards.
Our electricity use has decreased by 8,758,755 kWh (8%) since 2019-20, with significant falls in schools and streetlighting in recent years from LED replacement projects.
Our fleet emissions fell 11% this year as the council has continued to transition to electric vehicles, now comprising 20% of the fleet.
Emissions from the council's wider value chain (Scope 3)
Scope 3 emissions are those within the council's influence, but with less and varying degrees of control.
The main sources are:
- council homes
- council-owned non-domestic buildings operated by other organisations
- our procured goods and services.
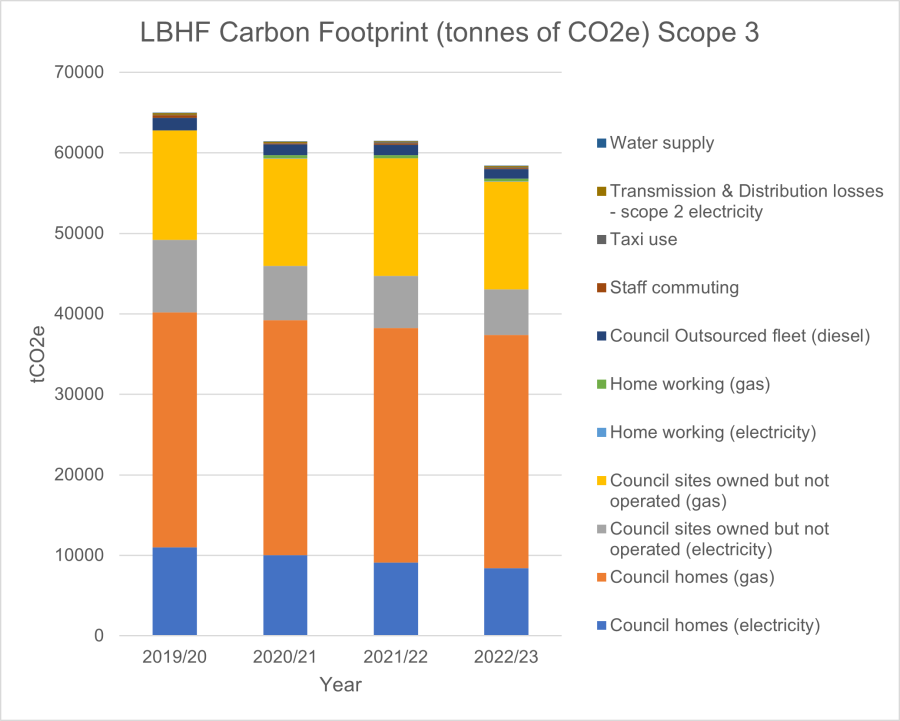
Excluding procurement, Scope 3 emissions have reduced by 10.2% from 2019-20 to 2022-23.
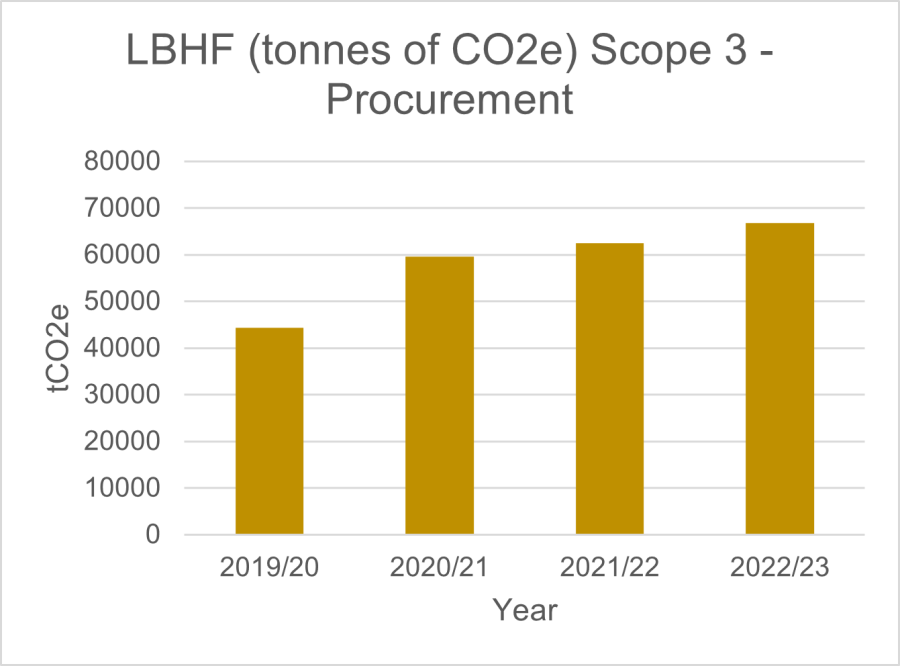
Estimated emissions from procurement have increased since the baseline year 2019-20 because spend on capital works was low in 2019-20, and because overall spend has increased - up 7% since 2021-22.
These are high-level estimates based on spend and are subject to some uncertainty.
We're working with our contractors to achieve more accurate estimations of emissions associated with our contracts, and to reduce these.