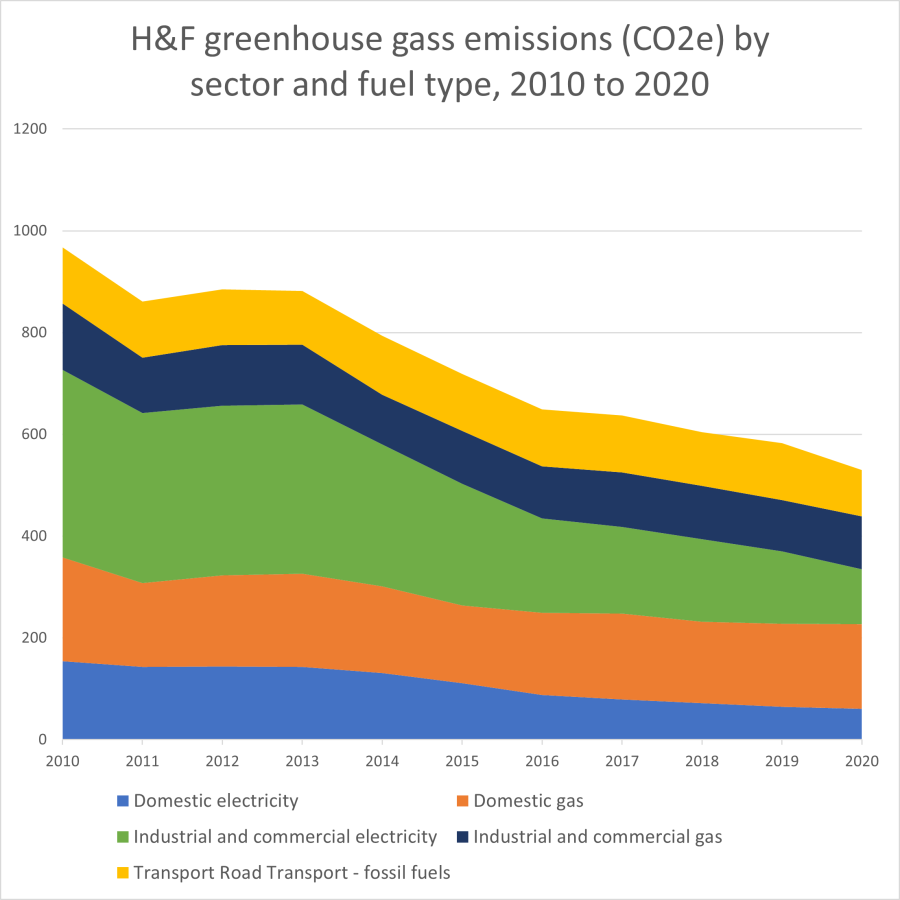
Territorial emissions
The borough's 'territorial' footprint refers to emissions from all fuels and electricity used within the borough boundary.
This has reduced by 46% between 2010 and 2020 (the most recent year available), mainly due to the increasing share of renewables in the national electricity grid.
The highest share of emissions is from gas use, mainly for heating homes and non-domestic buildings (47%). Emissions from electricity use in buildings (31%) continue to fall due to the increasing share of renewables in the national grid, and increased electrical energy efficiency.
Road transport (16%) fell in 2020, most likely as a result of reduced travel during the Covid-19 pandemic.
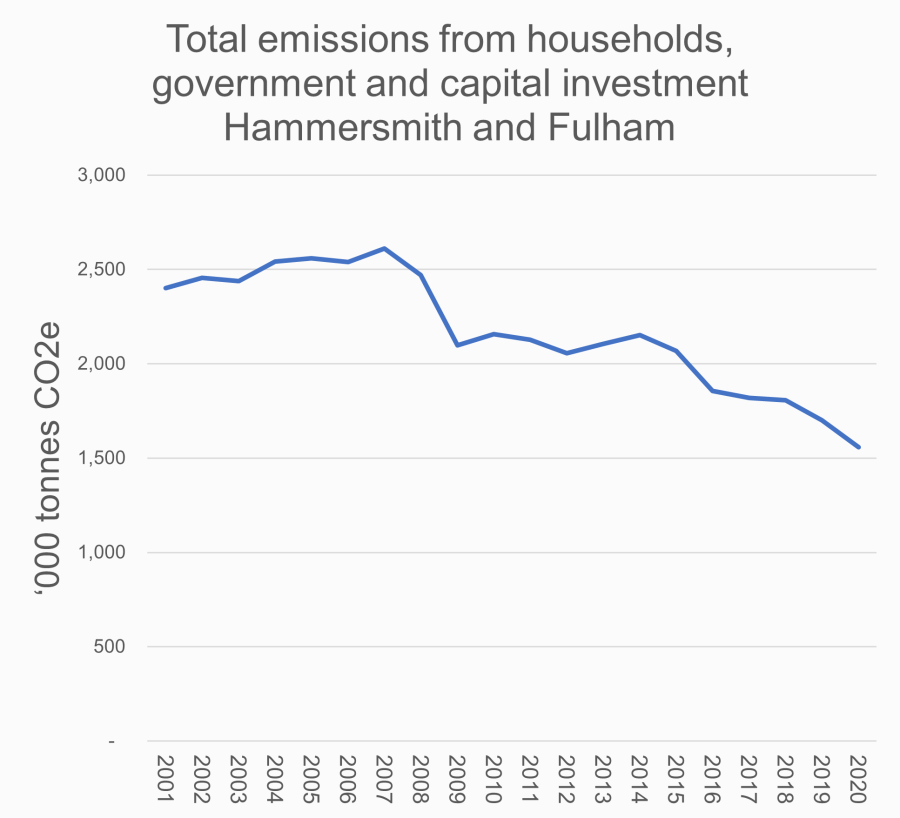
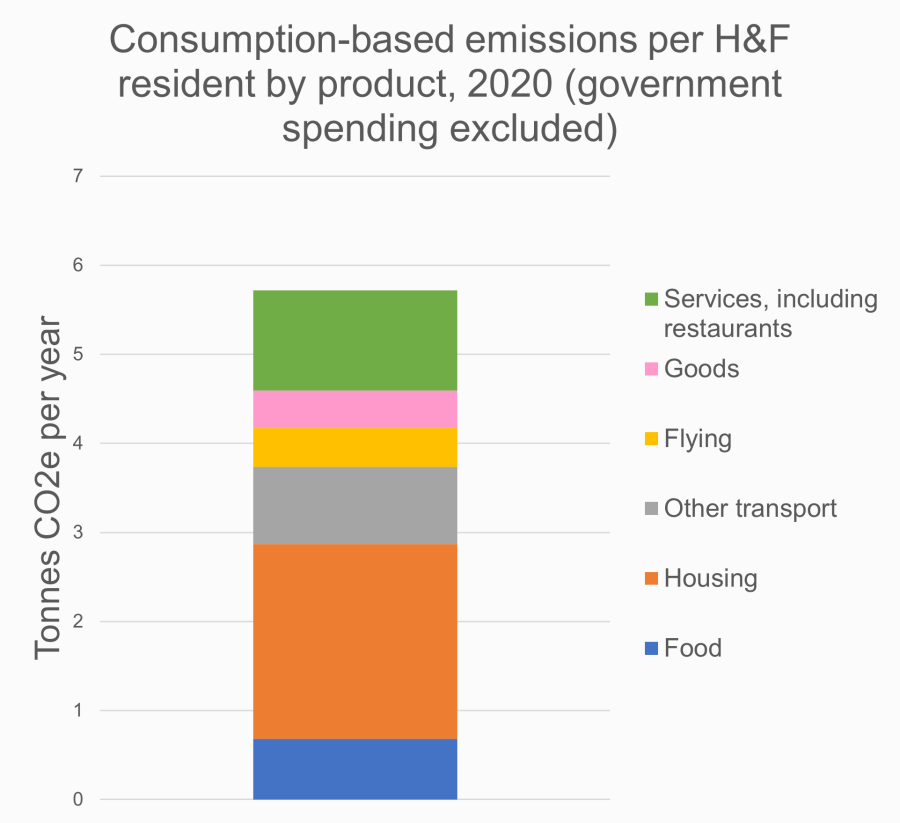
Lifestyle emissions
The 'territorial' footprint doesn't account for all the things residents buy and use that are imported into the borough - emissions occur outside the borough to produce and transport these.
Key sources of these 'lifestyle' emissions include food choices, new purchases and travel outside the borough.
When we include all these additional 'lifestyle' emissions, our footprint only reduced by 28% between 2010 and 2020 (the most recent data available), compared to the 46% decrease in our territorial footprint over the same period.
We can reduce these emissions by choosing to travel sustainably (such as avoiding flying or driving short distances), eating more plant-based meals, and by replacing new purchases with repairing, buying second hand, and sharing items.