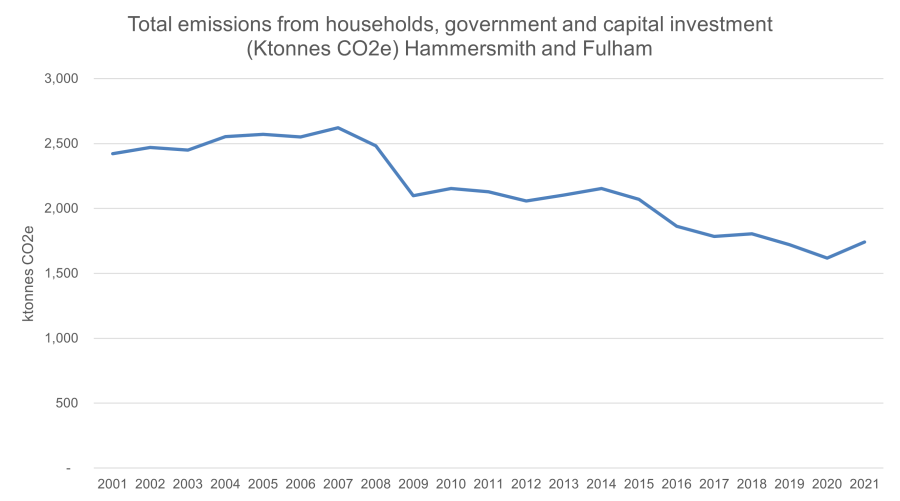
Territorial emissions
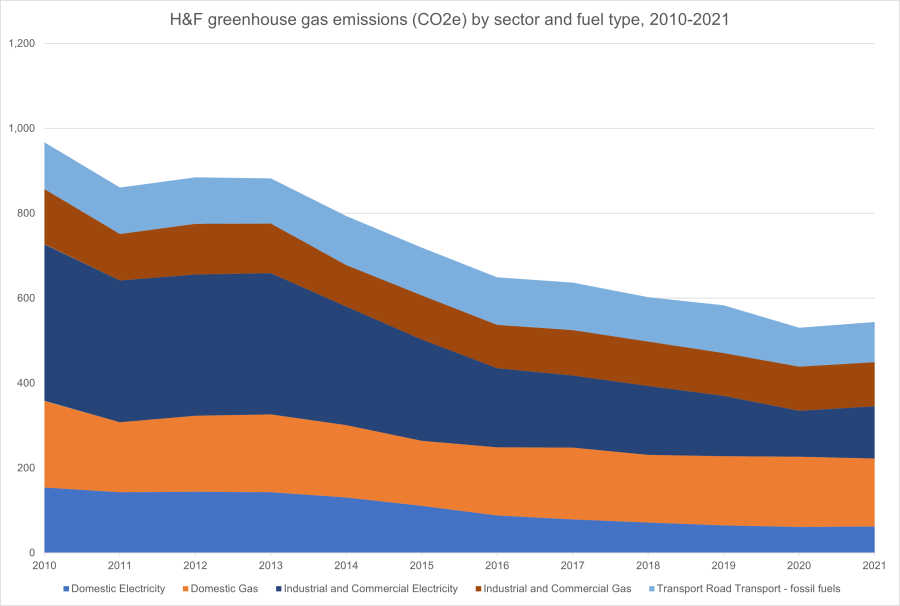
The borough's 'territorial' footprint refers to emissions from all fuels and electricity used within the borough boundary. Between 2010 and 2021, the most recent year for which data is available, this footprint has reduced by 43%.
Whilst emissions from domestic and industrial gas use remained consistent between 2020 and 2021, there were small year-on-year increases in emissions in other areas. This trend reflects a rebound from the significant reductions in emissions observed between 2019 and 2020 due to the Covid-19 pandemic.
Lifestyle emissions
The 'territorial' footprint of the borough doesn't account for all the things residents buy and use that are imported into the borough - emissions occur outside of the borough to produce and transport these goods and services.
Key sources of these 'lifestyle' emissions include food, purchases of consumer goods, and travel outside the borough.
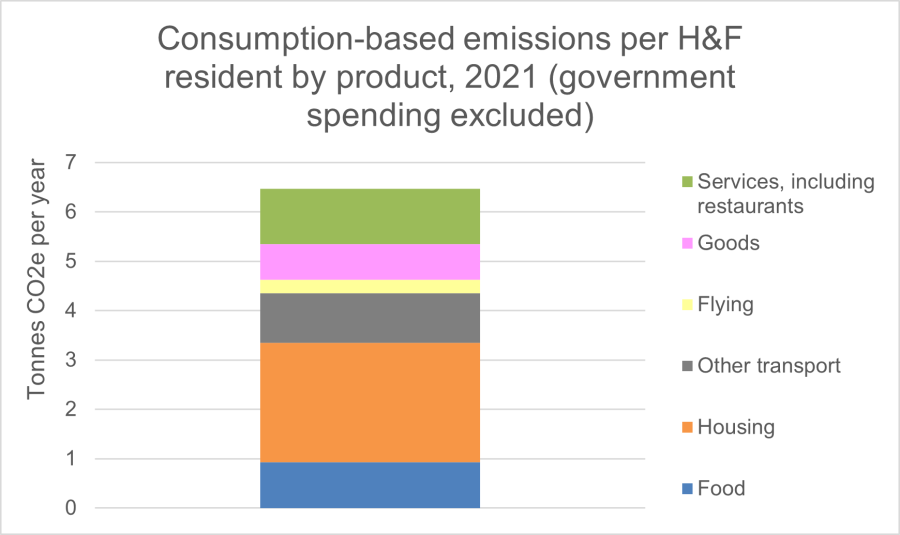
Between 2010 and 2021, we have seen a 26% reduction in consumption-based emissions per H&F resident. Consumption-based emissions are reducing at a slower pace than H&F's territorial emissions (43% reduction over the same period).
We can reduce these emissions by choosing to travel sustainably (such as avoiding flying or driving short distances), eating more plant-based meals, and choosing to repair, buy second-hand, or share items instead of making new purchases.