January 2023
Contents
- Exercise background & overview
- Background
- Objectives
- Funding
- Possible funding outcomes
- Project methodology (including tool used)
- Stages
- Tool used
- Data collection period
- Validation process
- Treatment of outliers
- Care homes providers (65+)
- Engagement plan
- Engagement & response rate
- Representation of provider market with responses
- Outcome of cost of care exercise
- Approach to inflation
- Approach to ROO & ROC
- Approach to calculating median
- Annex A Table
- Part 1
- Part 2
- Summary of Annex A
Exercise background & overview
- Background
- Objectives
- Funding
- Possible funding outcomes
Introduction
- In May 2022, Peopletoo were commissioned by Hammersmith & Fulham Council to support them to undertake and deliver a Fair Cost of Care exercise for 18+ Domiciliary Care Provision locally, in line with Department of Health and Social Care (DHSC) Guidance released in the Spring of 2022. This sets out the Government's expectations on Local Authorities (LAs) in ensuring that they have the right health and care architecture in place to underpin and support the delivery of the Government's long-term plan for Adult Social Care (ASC), 'People at the Heart of Care.'
- The cost of care exercise is an opportunity for LA commissioners and local care providers to work together to arrive at a shared understanding of what it costs to run quality and sustainable care provision in the local area, and that is reflective of local circumstances. It is also a vital way for commissioners and providers to work together to shape and improve the local social care sector, and identify improvements in relation to workforce, quality of care delivered, and choice available for people who draw on care.
- The objective of the work undertaken by Peopletoo was to provide the Council with reliable information submitted by the Domiciliary Care provider market via the excel-based Fair Cost of Care Toolkit, providing detailed information on Service Providers' actual delivery costs from April 2022 to inform a sustainable fee rate for the future as the Council moves towards implementation of the Fair Cost of Care.
- This Cost of Care report provides the Council with the detail surrounding Peopletoo's Fair Costing methodology and approach to ensuring provider engagement, the approach to validating returns submitted by providers to ensure accuracy, and clarification in relation to the approach to outliers following the validation stage where issues with returns remained.
- The detail in relation to the returns received (anonymised and aggregated) is also included in the report, by care home category:
Standard residential care,
Residential care for enhanced needs,
Standard nursing care,
Nursing care for enhanced needs.
ASC Reform - background
- March 2021: White Paper leading to Health and Care Bill in July 2021
- September 2021: 'Build Back Better: Our plan for Health and Social Care'
- October 2021: Autumn Spending Review – announcemen t of new care cost cap from October 2023 new National Insurance levy
- 16 Dec 2021: DHSC Fair Cost of Care Policy
- 23 September 2022: End of consultation for 2023/24 funding methodology
- 14 Oct 22: DHSC deadline For submission of:
- Cost of care Table
- Cost of Care Report
- Spend Report
- Provisional MSP
- Feb 2023: DHSC deadline for Final MSP
- October 2023: New £86,00 care cap and 'new' clients to have their eligible care needs met by their Local Authority
- April 2025: Existing Self Funders to have their eligible care needs met by their Local Authority
ASC Reforms - objectives
- People have choice, control and support to live independent lives
- People can access outstanding quality and tailored care and support
- People find social care fair and accessible
- Supporting unpaid carers to achieve their own life goals
- Helping the adult social care workforce to feel recognised and to have opportunities to develop their careers
- For social care to be on a stable financial footing
Social care additional funding
- The provisional social care financial settlement (December 2022) announcement detailed additional grant funding for social care. Most of the new funding is repurposing funding previously earmarked for social care reforms, which have been delayed for 2 years.
- The additional funding has 3 strands:
- The Social Care Grant will increase nationally by £1.5bn in 2023-24 to £3.9bn (£612m in London). In Hammersmith & Fulham (HF) Adult Social Care (ASC) will receive £4.1m. The grant is to help meet current pressures in ASC.
- A new ASC Market Sustainability and Improvement will be supported by a £562m ringfenced grant with £400m added to the existing £162m Market Sustainability and Fair Cost of Care Fund. In HF ASC receive £2.2m. This is to continue to support the progress local authorities and providers have already made this year on fees and cost of care exercises. The government expects this new grant funding will enable local authorities to make tangible improvements to adult social care.
- ASC Discharge Fund worth £300m, will be ringfenced for adult social care and will also help support capacity and hospital discharges. In HF ASC receive £1.4m.
- Grant conditions, yet to be published by DHSC, will provide further details on the use of the 2 ringfenced grants market sustainability and improvement and discharge fund.
Project methodology
- Stages
- Tool used
- Data collection period
- Validation process
- Treatment of outliers
Cost of care exercise stages
4-stage process
Stage 1 - Setting up for success
- Review of preferred tools.
- Review of MPS, JSNA and Commissioning Strategy.
- Data collation - demographic/market/ LA current rates.
- Engagement planning.
Stage 2 - Engagement with providers
- Key messages.
- Detailed comms planning.
- Meeting information requirements.
- Delivering workshops.
- Delivering 1-2-1 sessions
- Direct phone calls
Stage 3 - Data collation
- Supporting completion of templates.
- Chasing non-Returns.
- Chasing key blank fields.
- Validate submissions and handle queries.
Stage 4 - Analysis & reporting
- Cost of care data tables, demonstrating median costs.
- Understand what constitutes a reasonable profit or surplus to maintain a sustainable local market.
- Undertake analysis and model impact on the market and Local Authority expenditure.
- Wider benchmarking.
Tool used for exercise
Care home iese CareCubed tool
- Nationally recognised tool for the exercise
- Recognised tool already in use by a third of councils & 50 providers
- Included all key fields for data collection for analysis & validation
- A tool providers/ LAs could continue to use for future exercises
Data collection period
Care homes providers
- Providers were asked to submit their costing via the iese tool by 31.07.2022
- Providers were asked to submit their April 2021 - March 2022 costings and were given the option to suggest a % uplift across the lines from April 2022
- The 21-22 data has been used for analysis and an uplift will be applied to 21-22 costs to bring them up to 22-23 costs
- All of the uplift information supplied by providers has been reviewed to support the method of uplifting
Validation process
Highlight blanks submissions where key fields are blank

Develop benchmarks for medians at cost line from submissions data
Highlight outliers where per bed per week costings were proportionally out from medians
Identify line level anomalies driving outlier costings
Email providers to notify of queries to be raised and reviewed
Put into query with provider (+add line level comments on IESE platform)
Provider to resubmit with comments
Update tool with revised submission
Benchmarks automatically updated within tool
Repeat process to identify new outliers
General comments on the methodology
Having followed guidance, we are not confident that the cost of care figures provided here are fair or sustainable. This exercise presented significant and fundamental constraints, including issues with data quality, lack of clarity in the structure and guidance for the exercise and unreliable results being produced by the mathematical median calculation method. It provides data without the context and insight to come to an accurate judgement on the fair cost of care. This is because:
- The cost is derived from a sample of the care market that chose to provide data, so risks not being fully representative of the cost of care.
- Costs can vary significantly from provider to provider, impacted by factors that include the size of the organisation, variations in staff pay rates and use of agency staff.
- Due diligence has been carried out on the data provided, however, there was insufficient time to comprehensively review cost data with providers and there is no practical way of scrutinising central overheads.
- The median calculation method produced results that do not reliably reflect market costs, particularly in Hammersmith and Fulham's context of a very small sample size submission.
- DHSC guidance did not provide clear criteria for moderation (e.g. adjusting for Return on Operations (ROO) / Return on Capital (ROC)).
- DHSC guidance recommends querying outliers with providers, however there is no clear line between a cost being inefficient or an outlier. Due to the small sample size, outliers could not be identified.
- Rising inflation, living and running costs mean that the data submitted through this exercise at a point in time may no longer be accurate.
Given the smaller sample size of the provider submissions received, and the range of the data received, all provider submissions have been included and no exclusions were made for the calculation of the lower, median and upper quartile calculations.
Treatment of outliers
These limitations are such that the results produced by this exercise cannot be treated as wholly reliable or accurate. Hammersmith and Fulham intends to work with providers from 2022/23 to agree local fee rates that are sustainable for the Hammersmith and Fulham market.
Care home providers
- Engagement plan
- Engagement & response rate
- Representation of provider market with responses
Care home providers engagement plan
- Introduction
- Email & event invite
- Event reminder email
- Event joining instructions
- Introductory event
- Introductory session
- Event presentation email follow up & surgery invites
- Reminders
- Deadline reminder
- Final reminder
- 1-2-1 surgery sessions
- Offered to all providers
- Direct Calls
- Before deadline (all providers)
- After deadline to offer extension & 1-2-1 support (providers yet to submit)
- After extension (providers yet to submit)
Care home response rate
| Category | Total Number / % |
|---|---|
| Care homes in scope | 4 |
| Care home returns received | 2 |
| % Return rate out of providers in scope | 50% (2/4) |
| % of registered beds represented | 39.6% (158/399) |
| % of H&F commissioned residents represented | 54.8% (68/124) |
Reasons for non-participation:
The remaining 2 care homes in scope confirmed they did not want to participate as they were not comfortable sharing that level of sensitive data about their organisation.
Summary of care home provider engagement
- Critical to the success of the Cost of Care exercise was engagement with commissioned and registered care providers in Hammersmith & Fulham. Peopletoo were commissioned to lead this exercise and brought with them a wealth of experience and skill in engaging providers from across the breadth of adult social care services, building relationships, and exploring difficult questions to enable and provide access to key information.
- The framing around the exercise at the outset was crucial in supporting engagement with providers, and collaboration with local commissioners was central to the development of an effective communication plan, with key messages focusing on strategic relationship-building, mutual sustainability for the future and improving outcomes together. Effective and timely communication with the provider market prior to the commencement of the exercise was critical – clearly setting out exercise goals, timescales, and information requirements, plus a named key point of contact to ensure that providers could receive continual feedback throughout the process.
- Peopletoo were supported by National and Regional engagement and support opportunities which all providers locally were supported and enabled to access to ensure a breadth of information, advice and guidance was available.
- A range of engagement and feedback tools to make participation in the exercise easy for providers were established; creating opportunities to meet collectively and individually, to discuss and explore the specific information requirements. Peopletoo ensured that an auditable process for recording provider engagement and relevant outcomes of engagement was established, which also captured those that complete the cost of care tool kit, and those who chose not to register on the iese tool.
- Peopletoo's skills and experience in provider engagement provided a high level of independence to the exercise, creating open space between providers and local commissioners which often enabled greater discussion and freer information sharing. Barriers to provider engagement included capacity and the availability of time to undertake the exercise, the inability to complete the toolkit due to the way in which accounts were collated at provider level, and the inability to split data out against the required cost lines. 2 providers chose not to participate in the exercise.
Representation of market – funding type
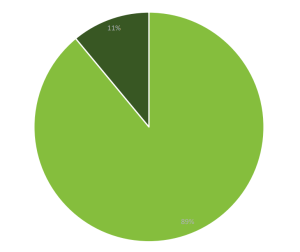
Residents Represented in Returns by Funding Type (21/22)
This pie chart shows the returns representation across all different funding types. As this is Private Finance Initiative (PFI) the majority of placements (89%) are Local Authority funded, 11% are self funders / privately funded.
Key
Light green: No. Local Authority funded residents
Dark green: No. self funders / privately funded
Representation of market – size of homes
Returns by size of homes
Of the two care home providers that responded as part of the engagement exercise, one has 66 bed spaces and the other 92
The two providers who responded are in the category of 50-60 CQC (Care Quality Commission) registered beds (of their total bed numbers)
The two providers based in H&F who declined to participate are larger and have more bed spaces
Representation of market – quality
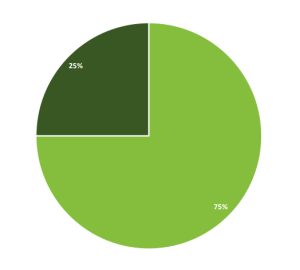
This pie chart shows the last CQC Overall rating for the four homes located in Hammersmith and Fulham.
75% of the care homes represented in the returns sample had a CQC overall rating of "good" at the time of writing this report.
25% of the care homes represented were listed as "requires improvement" at the time of writing this report.
The two care homes that submitted data were all rated as "good" at the time of writing this report.
Key
Light green: Good
Dark green: Requires improvement
Representation of market – occupancy levels
Occupancy rates 2021-22
- Home 1: 74%
- Home 2: 71%
2021/22 occupancy level were lower than usual / national benchmarks due to the homes being closed to admissions to manage Covid outbreaks.
2022/23 occupancy level is 100%
When looking at occupancy from total number of CQC registered beds, the occupancy is at a lower rate than would be expected from national benchmarks. This could be remodelled to see how costs would change at a 90-95% occupancy rate.
Outcome of cost of care exercise – care homes
- Challenges in the data
- Approach for calculating median
- Approach to inflation
- Approach to ROO & ROC
- Annex A Table
- Summary of Annex A
Challenges in the data
The Fair Cost of Care Exercise set out by the DHSC is one which is predominantly driven by the input of provider cost data, and as the exercise only sets loose guidance around validation parameters and the ability of local commissioners to challenge and interrogate the data in depth, several challenges in relation to data accuracy should be raised and noted.
Specially for Hammersmith & Fulham, these challenges include:
Accuracy of data provided
- Although validation has allowed for some interrogation of costs, it is not possible to completely verify that these costs are truly reflective of incurred costings.
Sample Size
- Due to the small number of care homes in borough, the sample size of the data collected is very small.
The impact of Covid-19
- The requirement to base a fair costing exercise on a year in which care homes and commissioners faced significant pressures in relation to occupancy and costs as a result of the Covid-19 pandemic is a challenge raised at a National level.
The inability to re-calculate higher occupancy and lower ROO/ROC
- In setting a fair cost of care locally, commissioners would like to be able to model several scenarios such as higher occupancy and lower Return on Operations and Return on Capital figures to better reflect an accurate local position. At the time of writing this report, there is limited availability in the toolkit to undertake this modelling. This is a challenge highlighted at a National level, with other commissioners wishing to undertake similar modelling activity.
Approach to calculating the median
There are a number of methods that can be used to calculate the median values for this CoC exercise.
- Medians calculated using end per resident per week costings from each submission
- Medians calculated at category subtotal level then summed
- Medians calculated at line level, summed at subtotals, then subtotals summed
The calculation method used for Annex A is option 3 after taking advice from the DHSC.
The median calculation is more suitable for large data sets, whereas for small sample sizes the addition or removal of a single value can significantly impact the median. This is particularly an issue to be considered within the Hammersmith and Fulham context. In addition, the homes that submitted data are under a PFI contract and therefore a median does not reflect actual costs.
Approach to inflation of 21-22 costs
- The data collected in the IESE tool asks providers to submit their 21-22 costs with an option to apply an uplift to bring those costs in line with April 22 costings.
- Hammersmith & Fulham have reviewed a number of inflationary methods to move providers actual 21-22 costs to April 22 costs. They have decided that the best method would be to apply an overall uplift of 3.5% in line with current PFI contractual arrangements.
| Category of Bed | Uplift applied |
|---|---|
| Care home occupied beds without nursing: Final total | N/A |
| Care Home occupied beds without nursing with dementia: Final total | N/A |
| Care Home occupied beds with nursing: Final total | 3.5% |
| Care Home occupied beds with nursing, dementia: Final total | 3.5% |
Note: Any assumptions made for this exercise need to be caveated as nationally there is uncertainty around inflation and cost of goods and services. This means that predicting future inflation is very difficult and needs to be reviewed in line with the council's policy to uplifts.
Applying proposed approach to inflation method of 21-22 costs
| Bed Type | Current Medians (21-22 Data) | 22-23 Medians (Calculated using agreed approach for inflation |
|---|---|---|
| Care Home occupied beds without nursing: Final total | N/A | N/A |
| Care Home occupied beds without nursing with dementia: Final total | N/A | N/A |
| Care Home occupied beds with nursing: Final total *includes FNC | £ 1,339.11 | £ 1,385.97 |
| Care Home occupied beds with nursing, dementia: Final total * includes FNC | £ 1,339.11 | £ 1,385.97 |
- Hammersmith & Fulham did not receive any submissions of care homes who have beds without nursing (ie. residential) and therefore is unable to provide data. See also Annex A, Part 2.
- Hammersmith & Fulham is currently unable to separate costings for care home beds with nursing with or without dementia and therefore the median value is the same.
Approach to ROO
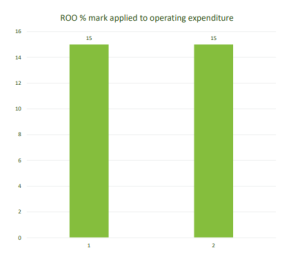
- This graph shows the ROO % listed by providers as part of this exercise. They were also given the option to submit this a cost as a value per annum.
- Overall, when looking at all submissions used to calculate Annex A, the ROO per resident per week came out between 12-17% of the overall per bed per week cost.
- H&F have reviewed submissions and guidance around benchmarks available and believe a ROO of 5% is fair to enable sustainability in the market for current and future provision.
- This would differ from the costings listed in Annex A and would need to be modelled separately.
Approach to ROC and future inflation
- The care homes that have chosen to participate in this exercise currently operate under a PFI model and ROC would not be applicable. H&F would consider a 5% ROC for non PFI provision.
- Future inflation uplift are determined by a number of factors
- Wider societal inflation
- Budget affordability
- Contract
- Demand and Capacity
- Quality of service benchmarked across North West London
- Each year, an uplift group recommends an approach to the senior leadership team, which decides on the final outcome. This outcome is then communicated to care homes. Any challenges to this outcome are looked at individually.
Care homes - Annex A – Part 1
| Cost of care exercise results - all cells should be £ per resident per week, MEDIANS. | 65+ care home places without nursing | 65+ care home places without nursing, enhanced needs | 65+ care home places with nursing | 65+ care home places with nursing, enhanced needs |
|---|---|---|---|---|
| Total Care Home Staffing | | | £929.72 | £929.72 |
| Nursing Staff | | | £355.32 | £355.32 |
| Care Staff | | | £385.88 | £385.88 |
| Therapy Staff (Occupational & Physio) | | | £0.00 | £0.00 |
| Activity Coordinators | | | £17.55 | £17.55 |
| Service Management (Registered Manager/Deputy) | | | £17.46 | £17.46 |
| Reception & Admin staff at the home | | | £26.86 | £26.86 |
| Chefs / Cooks | | | £48.28 | £48.28 |
| Domestic staff (cleaning, laundry & kitchen) | | | £64.65 | £64.65 |
| Maintenance & Gardening | | | £13.72 | £13.72 |
| Other care home staffing (please specify) | | | £0.00 | £0.00 |
| Total Care Home Premises | | | £39.18 | £39.18 |
| Fixtures & fittings | | | £0.54 | £0.54 |
| Repairs and maintenance | | | £17.55 | £17.55 |
| Furniture, furnishings and equipment | | | £2.79 | £2.79 |
| Other care home premises costs (please specify) | | | £18.30 | £18.30 |
| Total Care Home Supplies and Services | | | £162.44 | £162.44 |
| Food supplies | | | £47.26 | £47.26 |
| Domestic and cleaning supplies | | | £12.69 | £12.69 |
| Medical supplies (excluding PPE) | | | £18.39 | £18.39 |
| PPE | | | £0.00 | £0.00 |
| Office supplies (home specific) | | | £4.90 | £4.90 |
| Insurance (all risks) | | | £5.93 | £5.93 |
| Registration fees | | | £5.33 | £5.33 |
| Telephone & internet | | | £5.94 | £5.94 |
| Council tax / rates | | | £2.27 | £2.27 |
| Electricity, Gas & Water | | | £25.64 | £25.64 |
| Trade and clinical waste | | | £6.71 | £6.71 |
| Transport & Activities | | | £0.00 | £0.00 |
| Other care home supplies and services costs (please specify) | | | £27.38 | £27.38 |
| Total Head Office | | | £85.13 | £85.13 |
| Central / Regional Management | | | £12.95 | £12.95 |
| Support Services (finance / HR / legal / marketing etc.) | | | £53.96 | £53.96 |
| Recruitment, Training & Vetting (incl. DBS checks) | | | £18.22 | £18.22 |
| Other head office costs (please specify) | | | £0.00 | £0.00 |
| Total Return on Operations | | | £169.50 | £169.50 |
| Total Return on Capital | | | | |
| TOTAL | | | £1,385.97 | £1,385.97 |
Care homes - Annex A – Part 2
| Care Homes - Annex A – Part 2 | 65+ care home places without nursing | 65+ care home places without nursing, enhanced needs | 65+ care home places with nursing | 65+ care home places with nursing, enhanced needs |
|---|---|---|---|---|
| Number of location level survey responses received | N/A | N/A | 2 | 2 |
| Number of locations eligible to fill in the survey (excluding those found to be ineligible) | N/A | N/A | 4 | 4 |
| Number of residents covered by the responses | N/A | N/A | 42 | 41 |
| Number of carer hours per resident per week | N/A | N/A | 24.74 | 24.74 |
| Number of nursing hours per resident per week | N/A | N/A | 7.8 | 17.8 |
| Average carer basic pay per hour | N/A | N/A | £9.91 | £9.91 |
| Average nurse basic pay per hour | N/A | N/A | £21.54 | £21.54 |
| Average occupancy as a percentage of active beds | N/A | N/A | 74.1% | 74.1% |
| Freehold valuation per bed | N/A | N/A | N/a | N/a |
Note: Freehold valuation per bed was not provided in the submission received
Potential impact of Annex A CoC figures
| Bed Type | H&F Current Average Paid Rates | CoC 22-23 Medians (Calculated using agreed approach for inflation) | Potential Gap |
|---|---|---|---|
| Care Home occupied beds without nursing: Final total | N/A | N/A | N/A |
| Care Home occupied beds without nursing with dementia: Final total | N/A | N/A | N/A |
| Care Home occupied beds with nursing: Final total *includes FNC | £1004 | £ 1,385.97 | £381.97 |
| Care Home occupied beds with nursing, dementia: Final total * includes FNC | £1004 | £ 1,385.97 | £381.97 |
Averages calculated using data provided based on 65+ placements. Both submissions are nursing care homes only. Residential care home medians could not be calculated through the CoC exercise.
Overall conclusion and caveats
- Only two care homes submitted data. These two care homes are of the same group and operate under a PFI contractual arrangement. These homes have placements with nursing support.
- Two other care homes choose not to submit data and therefore no data was received that reflected placements without nursing support.
- Due to PFI contractual arrangements, (1) the median does not reflect actual costs and (2) a ROC value cannot be provided as the assets belong to H&F Council.
- H&F Council were informed that the return of the care home group reflected a national return for all care homes in the group and therefore it did not reflect a London Living Wage for care workers, which is stipulated by H&F Council.
- H&F Council is an exporter of residents (mainly to North West London) and their costs of care will impact on H&F Council disproportionately.
- Therefore, the Cost of Care result cannot be taken as a reliable representation of cost of care within H&F Council.
- The data quality concerns are such that, even after final analysis, it is necessary for Hammersmith and Fulham to consider other factors in setting fee rates as the Cost of Care outputs alone do not provide a reliable basis for fee setting.
- The outputs of this exercise will be one element to inform future negotiations, taking into consideration other known market factors including inflation, demand, capacity, benchmarking, quality and importantly affordability for Hammersmith and Fulham and availability of funding.